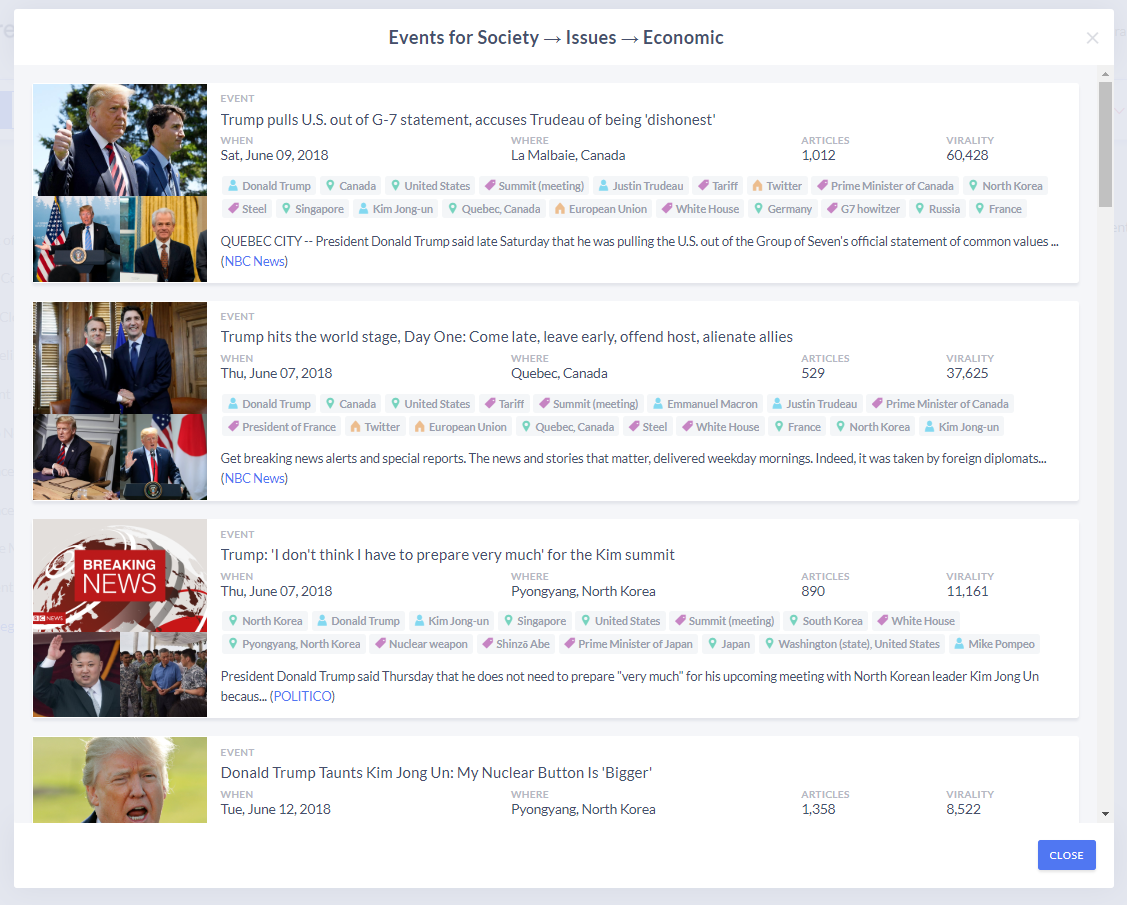
Content to display events: categories
The visualization of categories shows the categorization of events using the DMOZ taxonomy.
The chart represents the distribution of events into different categories. Each of the main categories is given a different color.
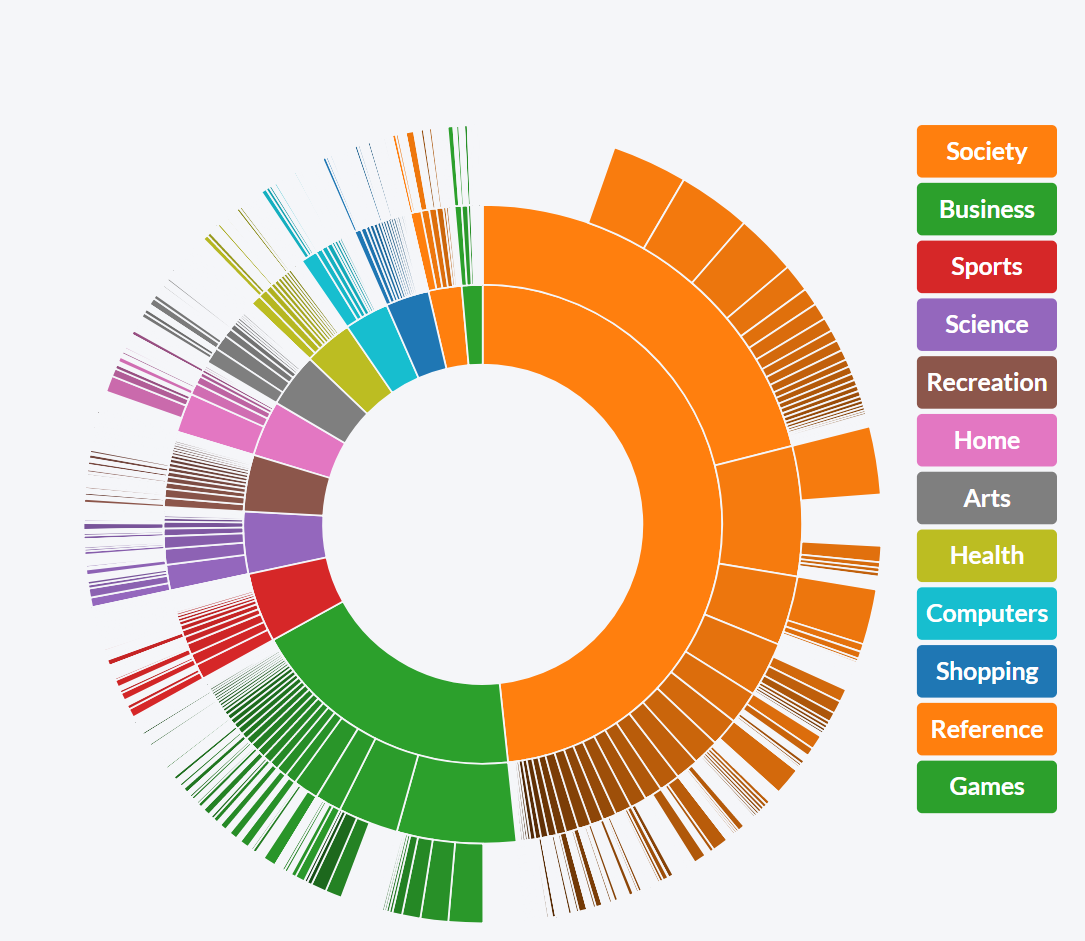
You can find sub-categories by moving the cursor toward the edges of the circle.
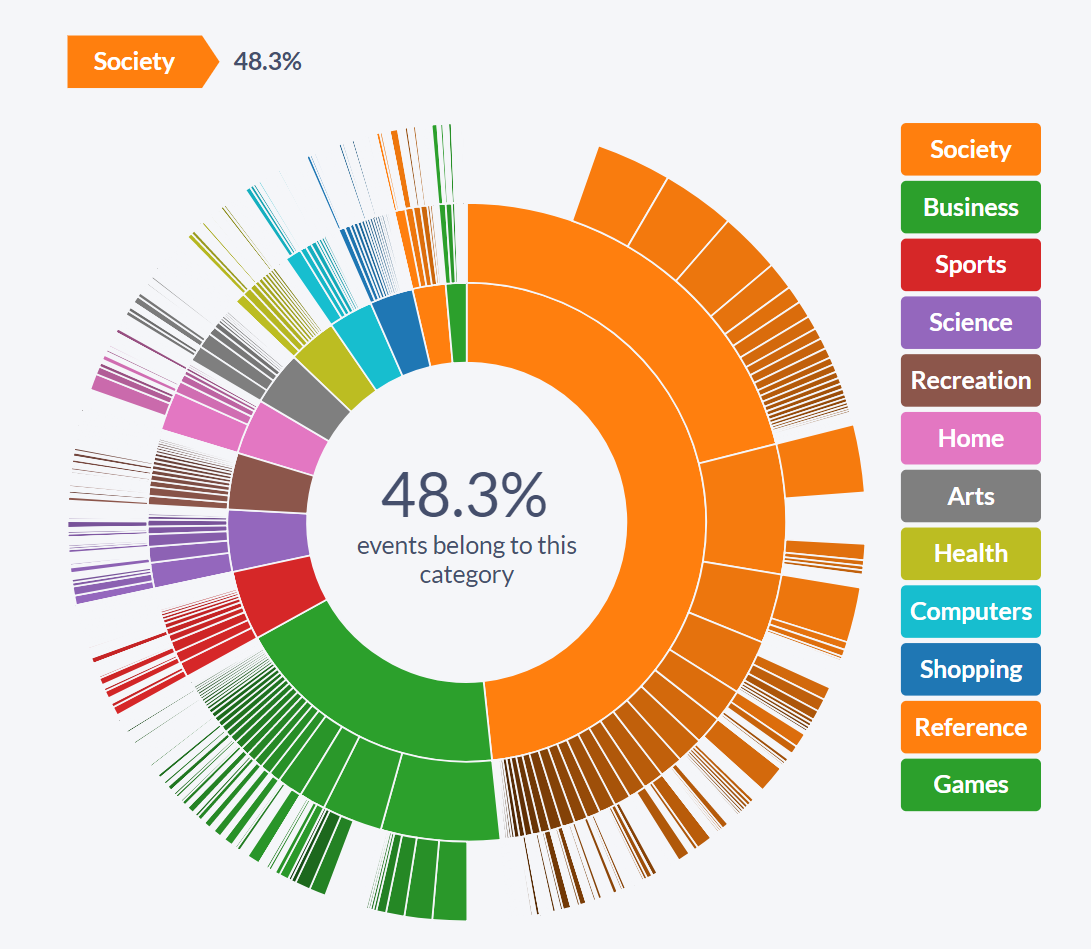
Clicking on a particular segment will display events belonging to this category.