
Content to display events: concept graph
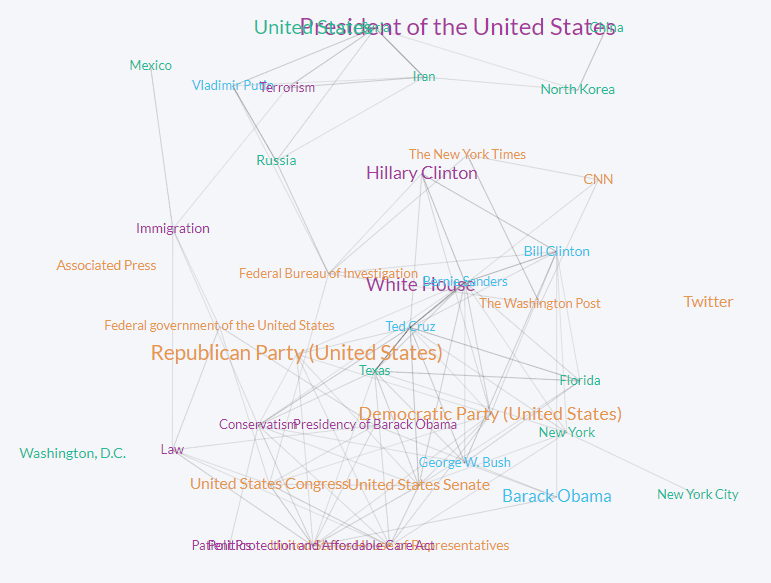
The entity graph can be used to understand the co-occurrence of concepts in the events. It displays a network of top entities in the results, where lines are drawn between the concepts that frequently co-occur in the same events.
The nodes in the graph represent concepts that frequently appear in the events. The edges between the nodes are displayed if a pair of concepts frequently co-occur in a selected set of events.
By using the checkboxes, you can choose which concept types to show in the graph. Check the box “Hide concepts used in the search query” to hide in the graph the concepts used in the search.
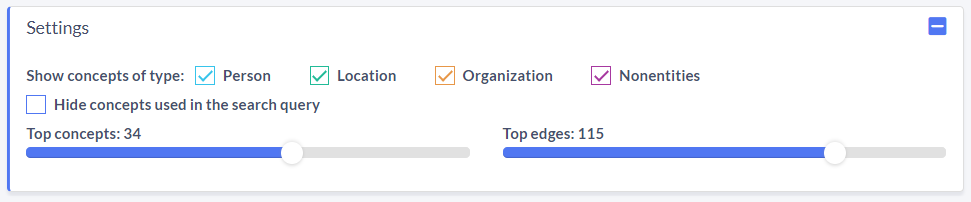
Set the amount of top edges or top concepts you want to see in a graph. You can set the amount of top concepts displayed on a scale from 10–50, and top edges on a scale from 10–150.