Event details: Article sources
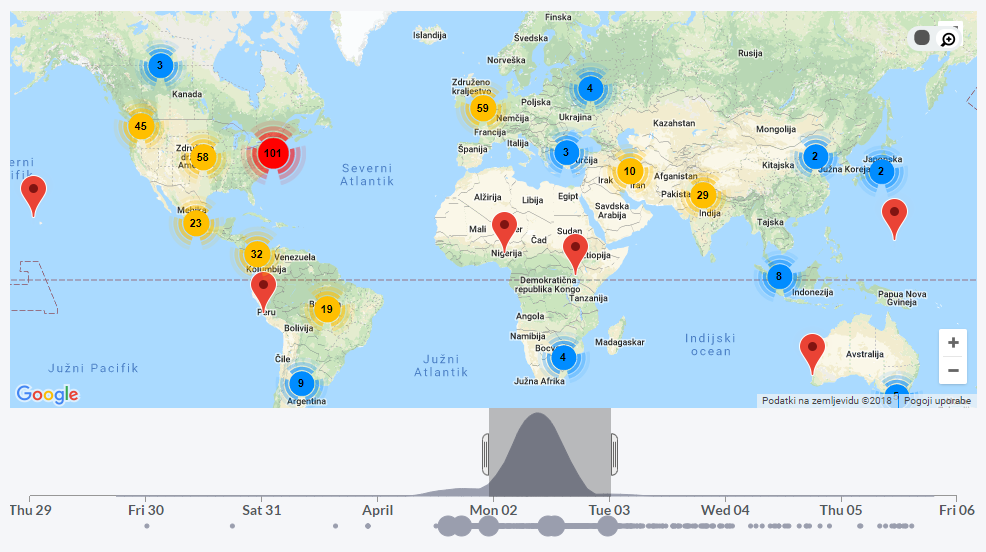
The map shows the geographical locations of the news sources that published articles about the selected event. When there is a high density of news sources at a nearby location, the map shows a cluster that displays the number of sources that are located in that geographical area. By zooming in, you can then find the specific locations of the sources.
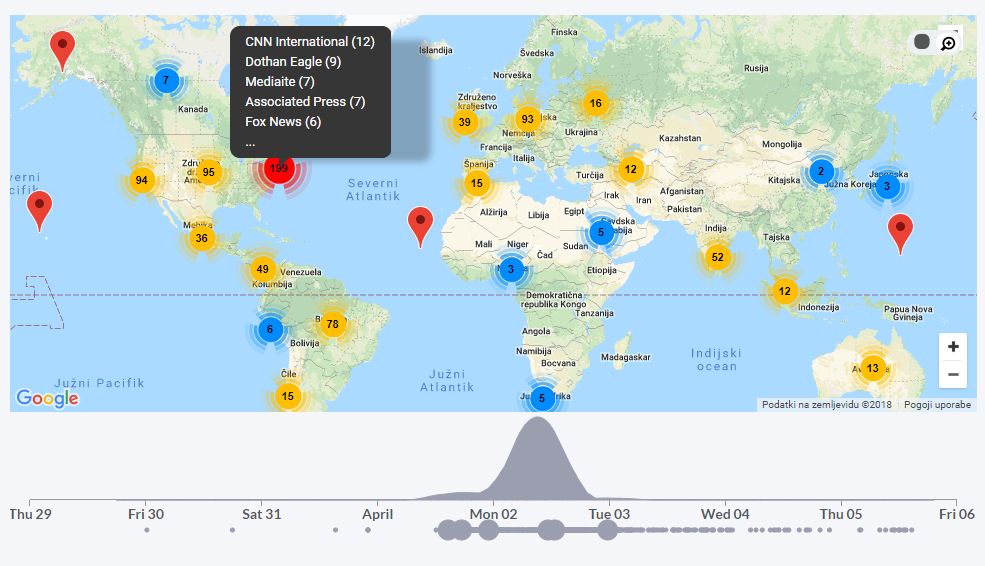
The timeline below the map represents the time distribution of articles. It is an interactive chart and you can click and drag to select a specific time period of interest and highlight only the news sources that reported in that time period.