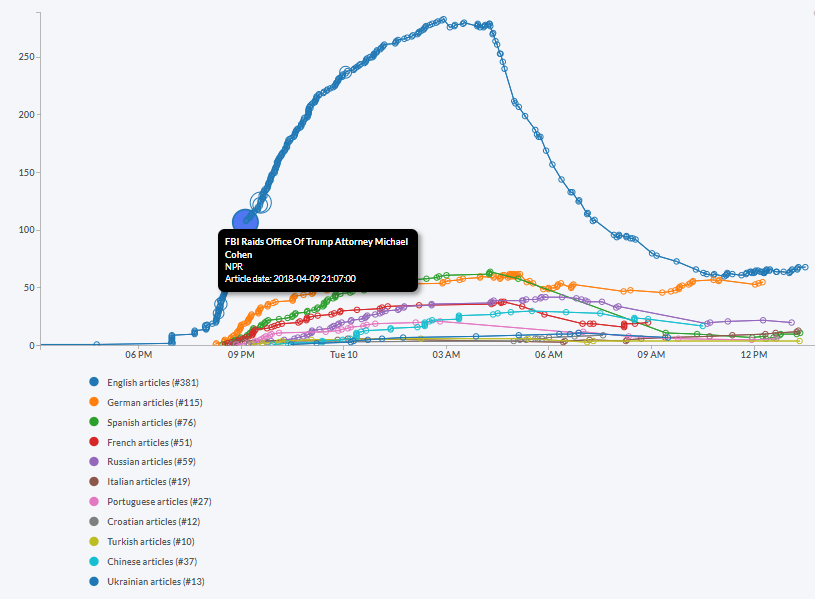
Event details: Reporting timeline
The timeline of articles displays the publishing times of articles describing the event. The height of the curve indicates the number of articles published in last 8 hours and therefore shows how intensive the reporting on that event was. Each differently colored curve represents a set of articles in a different language. The size of the point indicates how frequently the article was shared on social media.